
It’s still amazing to think of how robust the law-like patterns that govern how brands grow. Having done hundreds of the analysis across product categories, markets, and over different periods at the Ehrenberg-Bass Institute, they point out to undisputed evidence of laws such as Double Jeopardy, Duplication of Purchase, and Ehrenberg’s Law of Buying Frequency. Ehrenberg’s Law of Buying Frequency simply states that when we look at the distribution of purchase frequency across brand buyers, it will show far more light buyers (those who purchase not as frequently) than the heavy buyers (the frequent buyers). The implication is that rather than taking care of the select few, brands should aim for the all types of buyers who are predominantly light buyers.
This distribution is shown through a mathematical distribution called the Negative Binomial Distribution or the NBD. Colloquially, it is known as the reverse J distribution, because in most cases, when we order the frequency of purchase from the non-buyers, 1x, 2x, 3x, 4x … n-times’ buyers, the result looks like a reverse J. However, this is not always the case!
You may think that a particular category or market has ‘broken’ the Laws of Growth, when the distribution does not follow the classic reverse-J curve. I won’t go all geeky and mathematics in this post — but when we look at categories or brands with high penetration and high purchase frequency (think about soft drinks, confectionery, fast food) over an extended period, chances are the distribution pattern will likely show something that looks more like a bell curve than a reverse-J. This doesn’t mean that it’s not a Negative Binomial Distribution, because it still is – even if it looks like a normal distribution. This is because when we look across the period, most of the shoppers have made the purchases and have done so at a high frequency — making the spread of purchase frequencies more symmetrical than the typical NBD.
There are practical ways to go around this when analysing such data – but I want to focus this post on the fact that even when we look at an NBD that looks like a ‘normal’ distribution, the key tenet remains: there are many light brand buyers who need to be reached for advertising and brand building. Let me highlight it through a presentation deck that I came across recently: on how often Americans go to fast food restaurants — or to be more formal, Quick Service Restaurants (QSR). I scraped the data off one of the slides and presented it differently. The data only has qualitative frequency classification rather than specific frequency values – but we can still work with this.
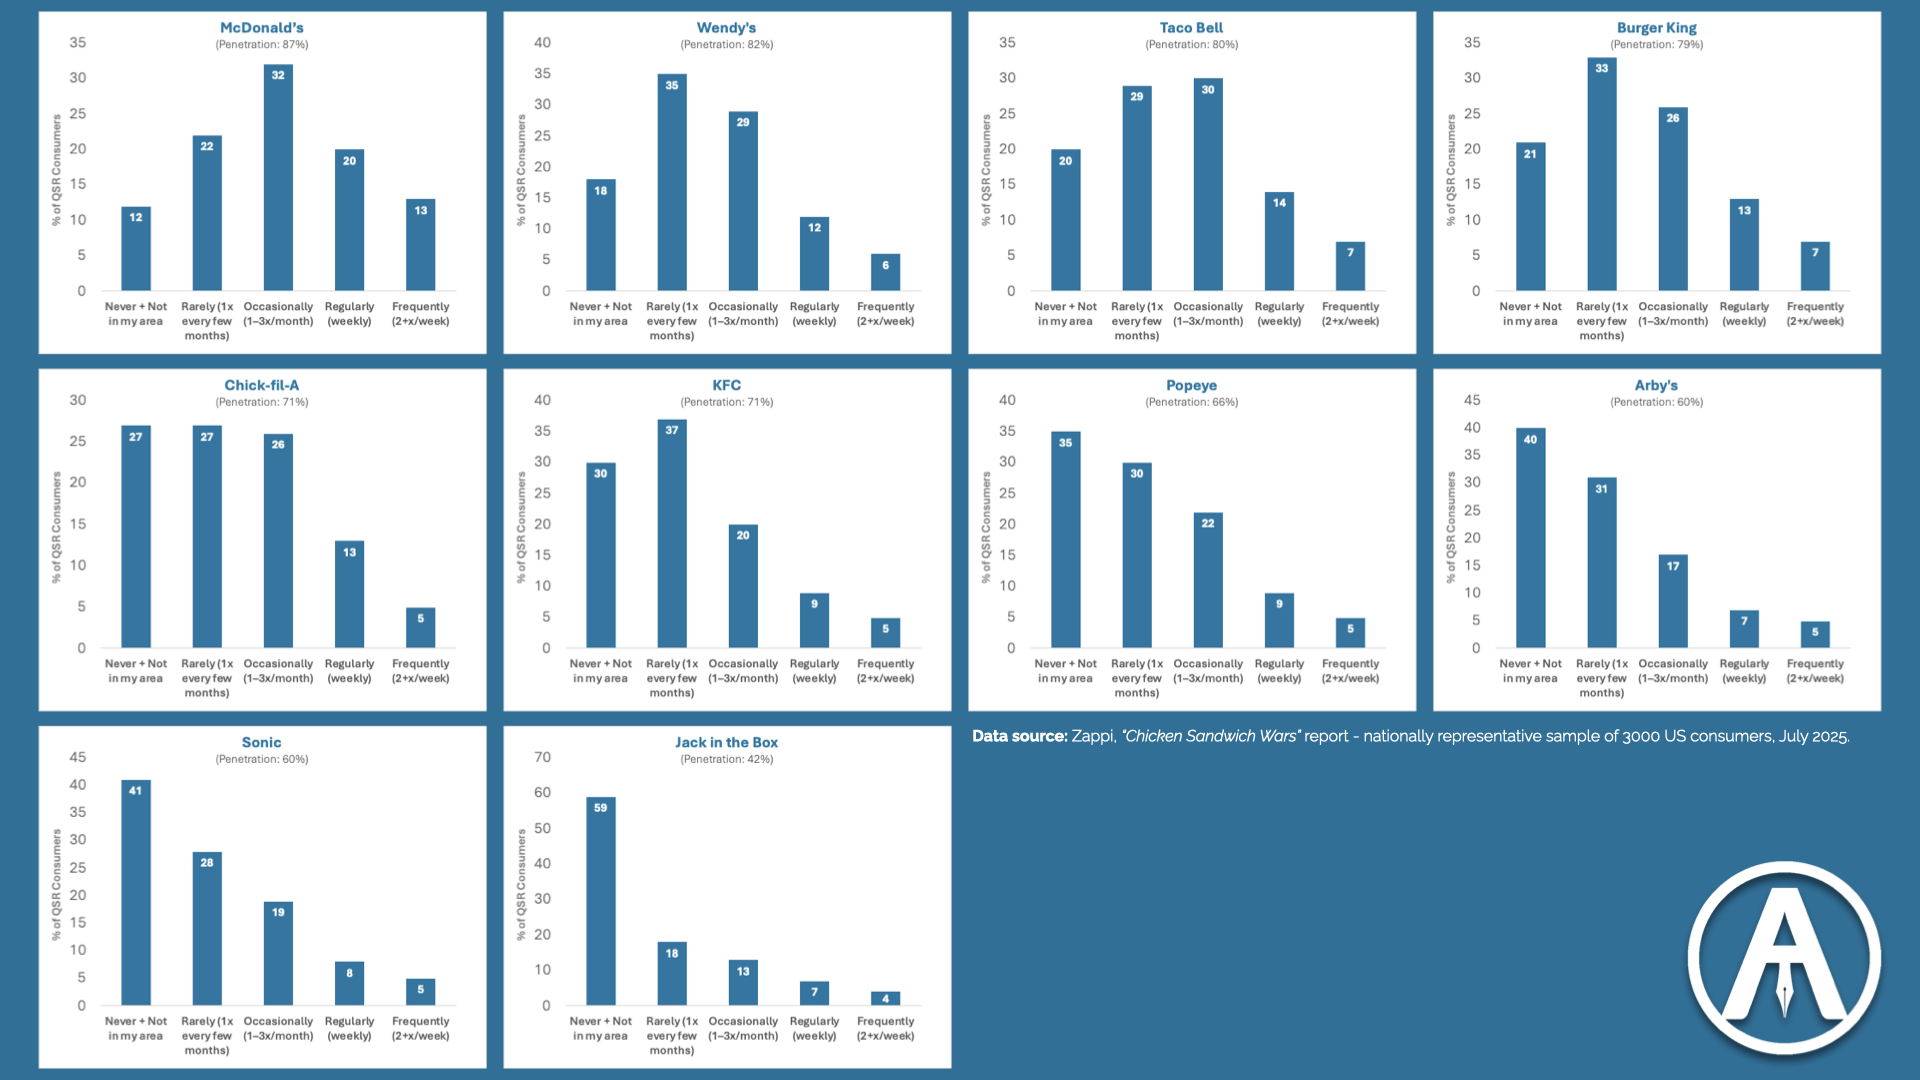
In this data, brands such as McDonald’s and Wendy’s do not show a reverse-J curve which may suggest that at such high penetration (87% and 82%), light buyers are less important compared to those who purchase regularly. However, when you look at the figures closely, you will see that around one-third of the sample had either not been to McDonalds’s or only been there once every few months. That represents a massive opportunity for the brand. Combining the first two columns reveal the potential for the other brands too: 53% for Wendy’s, 49% for Taco Bell, and a staggering 77% for Jack in the Box as one of the smaller brands.
So for fast food restaurants, they will need to continuously appeal towards all category buyers – even big brands need to continuously advertise. This is why we continue to see ads for big brands such as Coca Cola, Pepsi, M&Ms on our socials, TV, and other media platforms.
If you notice the shapes of the frequency distribution as well, what started as something that look similar to a bell-curve ends up looking like the familiar reverse-J distribution. Not all NBD distributions look like a reverse-J, and when you see a bell curve distribution, it doesn’t mean that you have finally broken the Ehrenberg’s Law of Buying Frequency. It just means that you may need to zoom in closer – maybe at a shorter time frame – to learn about the context of the category and the brand purchase.